Relationship of Non-Dipper and Reverse-Dipper Pattern with Sleep Quality in Normotensive Patients
Article information

Abstract
Objectives
It has been observed in many different populations that circadian blood pressure (BP) patterns have a significant impact on cardiovascular (CV) results. Important predictors of CV morbidity and mortality are known as non-dipper (ND) and reverse-dipper (RD) BP pattern. RD and ND patterns are frequently encountered in many normotensive patients in daily practice.
Methods
The purpose of this study is to evaluate the frequency and quality of sleep, especially in normotensive young individuals, by using sleep questionnaires and to evaluate their relationship with poor BP patterns. A total of 195 normotensive patients (68 dippers, 63 ND, and 65 RD) were enrolled into this cross-sectional study. The insomnia severity index (ISI), Epworth sleepiness scale (ESS), and Pittsburgh sleep quality index (PSQI) approved questionnaires were applied to evaluate the presence and severity of sleep disorders and to determine the patient’s sleep quality.
Results
When dipper and ND groups were compared, significant differences were observed in ISI, ESS, and PSQI (p<0.001). Then, the study patients were re-evaluated as dipper, ND, and RD groups and seen this significant difference continued (p<0.001). Also, the sleep time was significantly different between all groups of dipper (7.23±0.11 hours), ND (6.72±0.15 hours), and RD (5.79±0.11 hours) (p<0.001). In the correlation analysis, a significant inverse relationship was observed between sleep time and all survey results (p<0.05).
Conclusions
RD and ND patterns are associated with sleep quality in healthy individuals. It is necessary to evaluate patients with RD and ND BP patterns in normotensive individuals in terms of sleep disorders in detail.
Introduction
Circadian blood pressure (BP) rhythm, which has also been reported in most normotensive and hypertensive individuals; BP values during the night are 10% to 20% lower than daytime values due to a decrease in sympathetic tone and parallel increase in vagus stimulation over sleep period. A nocturnal BP drop of less than 10% is generally accepted to identify patients with abnormal circadian rhythms [non-dippers (NDs)] [1]. Also, reverse-dipper (RD) pattern (ie, the phenomenon characterized by higher night-time compared with daytime BP values) is an alteration of circadian BP rhythm and generally regarded as a harmful condition [2]. In addition to structural and functional changes of the left ventricle in the hypertensive population, circular BP patterns have a significant impact on cardiovascular (CV) results [3]. ND BP pattern has been proven as an important predictor of CV morbidity and mortality [4]. RD and ND patterns are frequently encountered in many normotensive patients in daily practice. However, there is still insufficient evidence to explain the reason.
Sleep disorders are a group of conditions that negatively affect the ability to sleep well and cause significant impairments in social and professional functions. Sleep disorders are a broad category of diseases that include any sleep-related dysfunction, including difficulty in falling asleep at night, poor quality of sleep, early awakening, circadian rhythm disorders, parasomnias, sleep-related movement disorders, and sleep-related respiratory disorders [5]. Insomnia is defined as persistent difficulty with sleep initiation, sleep consolidation, and staying asleep, resulting in poor sleep quality [6]. The consequence of sleep disorders is often daytime fatigue. Also, inadequate sleep is a known risk factor for obesity, diabetes, heart disease, and depression [7]. In recent years, especially in young individuals, sleep disorders have increased due to developing technology and lifestyle changes. It is noteworthy that many patients have ND and RD patterns although they are normotensive in ambulatory blood pressure monitoring (ABPM). Therefore, in this study, we aimed to determine the frequency and quality of sleep, especially in normotensive young individuals, by using sleep questionnaires and to evaluate their relationship with poor BP patterns.
Methods
This study was performed at the Departments of Cardiology of Afyonkarahisar Health Science University between January 1, 2018 and December 1, 2019. A total of 195 patients with normotensive; 68 dippers, 63 ND and 65 RD (proven by 24-h ABPM) were enrolled into this cross-sectional and prospectively study. The participants consisted of healthy volunteers and applicants to the hospital for other reasons. All patients underwent a twenty-four-hour ABPM (WatchBP 03 Ambulatory Blood Pressure 2G System, Microlife AG Swiss Corporation, Wİdnau, Switzerland). In ABPM measurements, the night period was determined as 22:00 in the evening and 8:00 in the morning, and the same hours were used in all patients. Nevertheless, the findings were analyzed by evaluating the results according to the sleep time of the participant in the ABPM analysis. Frequency of ABPM measurements was determined as 30 minutes for daytime and night-time hours, and all patients were informed about the appropriate positions before the measurement and about the determined night hours. Laboratory findings and demographic variables of all patients were recorded. The study protocol complied with the ethical principles of the Declaration of Helsinki and received full approval from the Institutional Review Boards of Afyonkarahisar Health Sciences University Ethics Committee (no.2019/51). Under this approval, informed consent was waived.
The following definitions were used: normotension: BP ≤140/90 mm Hg and no use of antihypertensive treatment, dipper pattern: systolic BP/diastolic BP decreased >10%, ND pattern: absence of a >10% drop in nocturnal BP, RD pattern: nocturnal BP rise, hypercholesterolemia: total plasma cholesterol levels of >200 mg/dL or plasma low-density lipoprotein cholesterol levels of ≥130 mg/dL or triglyceride levels of ≥150 mg/dL or high-density lipoprotein cholesterol levels in male ≤40 mg/dL and in women ≤50 mg/dL and/or using lipid lowering agents, diabetes mellitus: fasting plasma glucose ≥126 mg/dL for at least two times (6.94 mmol/L) and/or taking glucose lowering treatment.
Patients aged under 18 and over 65 years, and having hypertension, diagnosis obstructive sleep apnea syndrome (OSAS) or clinical OSAS symptoms and signs, hormonal disorders (except thyroid disorders), autonomic nervous system disorders, atrial fibrillation, heart and kidney failure, and pregnancy were not included. Patients using drugs such as antiarrhythmic agents, beta-blockers, and nitrates that affect BP and heart rhythm were excluded. Flow chart of the study was presented in Fig. 1.
Flow chart of the study. BP: blood pressure, ABPM: ambulatory blood pressure monitoring.
The main aim of our study to examine the relationship between night-time abnormal BP patterns and sleep quality. Therefore, an insomnia severity index (ISI), Epworth sleepiness scale (ESS), and Pittsburgh sleep quality index (PSQI) validated questionnaire (in Turkish) were administered to evaluate the presence and severity of sleep disorders and to assess the patient’s sleep quality [8-11].
Questionnaires, scoring, and interpretation
Although ESS is a self-administered 8-item questionnaire that evaluates excessive daytime sleepiness, we applied all surveys to patients to exclude the compliance problem. Respondents are asked to rate, on a 4-point scale (0–3), their usual chances of dozing off or falling asleep while engaged in eight different activities. An ESS >10 points suggest the presence of excessive daytime sleepiness and results were evaluated in 5 groups [lower normal (0–5), higher normal (6–10), mild excessive (11–12), moderate excessive (13–15), and severe excessive sleepiness (16-24)] [12].
ISI is a seven-item questionnaire designed as a short screening tool for insomnia. The questionnaire asks participants to assess the presence and symptoms of insomnia, such as sleep pattern satisfaction and how insomnia interferes with daily functioning. A 5-point Likert scale is used to rate each item (for example, 0=no problem; 4=very serious problem), giving a total score ranging from 0 to 28. The total score is interpreted as follows: lack of insomnia (0–7); subthreshold insomnia (8–14); moderate insomnia (15–21); and severe insomnia (22–28) [13].
PSQI is a self-report that evaluates sleep quality in 1 month period. The measure consists of 19 global items and consists of 7 components that produce a global score. Component scores consist of subjective sleep quality, sleep time, sleep delay, sleep disturbances, habitual sleep efficacy, use of sleeping pills, and daytime dysfunction. The global PSQI score is calculated by adding up the seven component scores, providing a general score ranging from 0 to 21, where scores lower than 5 components represent a healthier sleep quality [14].
Statistical analysis
Statistical analyses were conducted by using the SPSS software version 23.0 (IBM Corp., Armonk, NY, USA). The variables were analysed using visual and analytical methods (Kolmogrorov-Smirnov) to determine a normal distribution. The mean and standard deviation, or median and interquartile ranges were used for descriptive statistics. The Chi-square test was used to compare ordinal and categorical variables (such as gender, diabetes, and hyperlipidemia). Mean values of variables with normal distribution were tested with t-test and abnormally distributed variables were tested with non-parametric MannWhitney U test. The correlations between the quantitative variables were evaluated using Spearman’s test because of the abnormal distribution. In addition, Kruskal-Wallis test was used to compare data in subgroup analysis. The Mann-Whitney U test was performed to test the significance of pairwise differences using Benferroni correction to adjust for multiple comparisons. A p-value of less than 0.05 was considered statistically significant.
Results
A total of 195 participants were included in this study. The participants were separated two and three groups according to the BP pattern. The average age of the dipper, ND, and RD groups were 38.12±1.13, 36.17±1.20, and 38.83±0.98 years, respectively. Demographic variables of the groups were similar in our study for age, sex, diabetes mellitus, thyroid dysfunction, and hyperlipidemia. Demographic variables and laboratory findings of the groups were presented in Table 1.

Baseline demographic and laboratory values of study groups
When dipper and ND groups were compared, significant differences were observed in ISI, ESS, PSQI, and sleep time (p<0.001). Especially, subthreshold (40.2%) and moderate (30.5%) insomnia were significantly higher in the ND group compared to the dipper group. In addition, mild, moderate, and severe daytime sleepiness was significantly higher in the ND group. Also, we found that there was significant poor sleep quality in the ND group (Table 2).
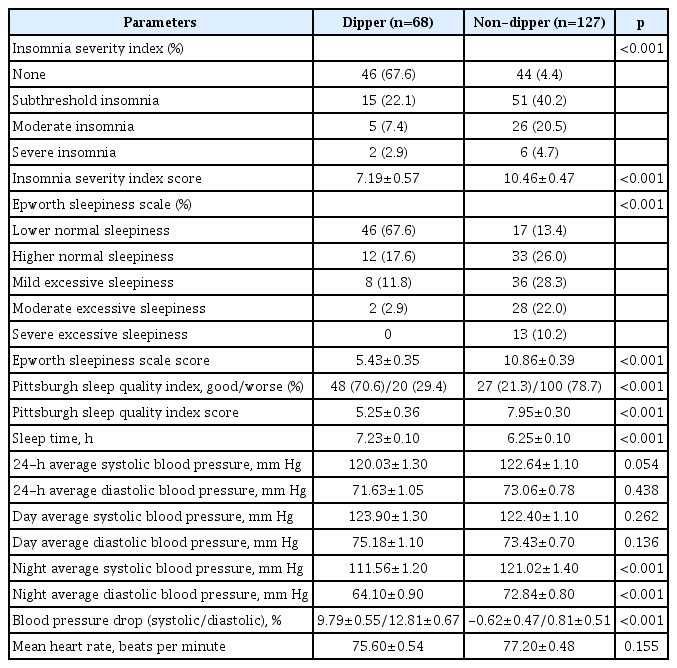
Analysis of sleep scales and blood pressure between dipper and non-dipper groups
The study patients were re-evaluated as dipper, ND, and RD groups and seen this significant difference continued. When the ISI and PSQI questionnaires were evaluated, there was a significant difference between the dipper and other groups. In the ESS survey, the difference between all groups was significant. Also, the sleep times were significantly different between all groups of dipper (7.23±0.11 hours), ND (6.72±0.15 hours) and RD (5.79±0.11 hours) (p<0.001). The analysis of sleep scales between all groups is shown in Table 3. As expected, night-time BP changes were significantly different according to the BP pattern. As a result, insomnia, daytime sleepiness, and sleep quality impairment were observed more in the ND and RD groups than dipper group.
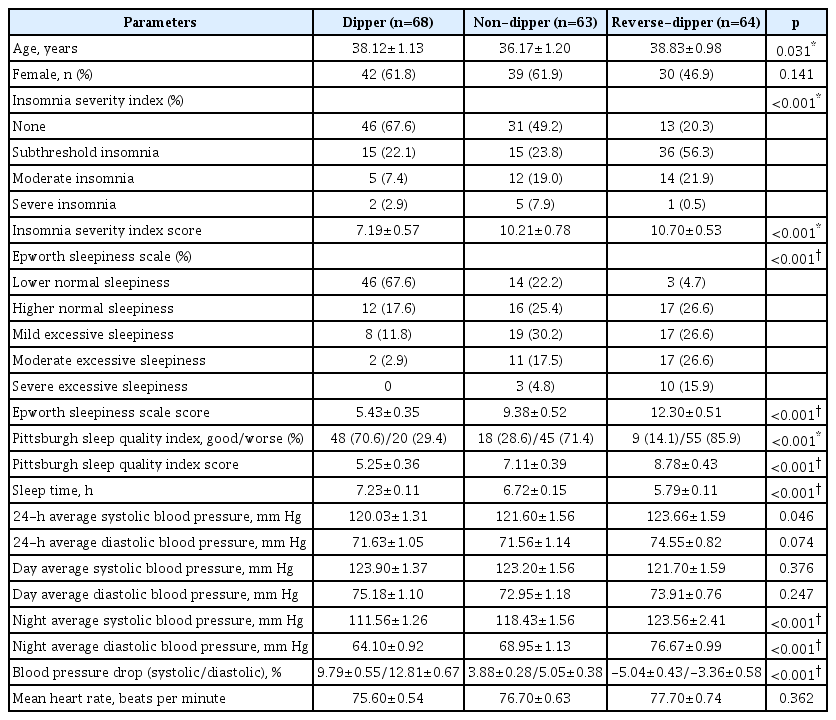
Analysis of sleep scales between all groups
In the correlation analysis, a significant inverse relationship was observed between all survey results (p<0.001). A significant correlation was observed between sleep time and ISI (r:-0.447, p<0.001), ESS (r:-0.408, p<0.001), and PSQI (r:-0.424, p<0.001) results. Also correlation results between “ISI, ESS, PSQI, and systolic & diastolic dipper” are presented in Fig. 2.
Correlation between sleep indices and blood pressure drop. (A) Correlation analysis between ISI score and S&D dipper. (B) Correlation analysis between ESS score and S&D dipper. (C) Correlation analysis between PSQI score and S&D dipper. ISI: insomnia severity index, ESS: Epworth sleepiness scale, PSQI: Pittsburgh sleep quality index, S&D: systolic & diastolic.
Discussion
It shows with increasing evidence that the ND and RD pattern produces more pronounced cardiac and extracardiac organ damage, and more importantly, the probability of CV event increases compared to patients with preserved nocturnal BP drop [15,16]. The technology and lifestyle changes developed in recent years cause many changes in human body. The cause of ND and RD BP pattern, which can be observed especially in healthy individuals, is still not clearly understood. To the best of our knowledge, the findings of this study support some previous studies [17-19]. As a result of our study, we found that especially in ND and RD groups, there was increased sleep disturbance and insomnia and decreased sleep time.
Sleep is fundamental to a person’s emotional and physical health. Insomnia is the one of the most common medical complaints and affects about 10% of adults worldwide. It usually coexists with medical, sleep, psychiatric, or neurological disorders, but may also be associated with medication or substance, poor sleep habits, or changes in the sleep environment. One of the main signs of insomnia is poor quality of the next day [20]. Vgontzas et al. evaluated the relationship between insomnia and hypertension and showed that the risk of hypertension was significantly increased at 1-year follow-up in patients with insomnia (sleeping <5 or 5–6 hours per night) compared to normal patients (sleeping more than 6 hours per night) [21]. In the study of Zhao et al. who evaluated the sleep quality of 1,006 hypertensive patients over 65 years of age with PSQI, individuals with poor sleep quality were found to be more prone to RD BP rhythm [22]. In the study of Lyu et al. evaluating 368 normotensive individuals between the ages of 30–60, it was found that clinical features of insomnia and poor sleep quality are associated with non-dipping BP [18]. In Lyu et al.’s study using the Wisconsin Sleep Cohort [18], polysomnography and ABPM readings of all participants were obtained at random intervals, every 15–20 minutes during wakefulness, and every 30 minutes during sleep. In our study, ABPM measurements were obtained during wakefulness and sleep every 30 minutes. Although our measurement frequencies were different, our results were similar.
In the study of narcolepsy patients, it was found that 85% of these patients had ND BP patterns and this was related to sleep quality [23]. Lanfranchi et al. found that the impairment of BP drop and ND pattern were significantly higher in the insomnia group compared to the control group [19]. In particular, we think that the relationship between decreased sleep time and disruption of BP pattern found in our study is an important finding. We think that the lack of expected nighttime BP reduction in these patients may be associated with future CV events. In previous studies, there were findings and predictions supporting our hypothesis.
The absence of a decrease in BP in the night period, which is more common in situations such as essential hypertension, is a multi-factor condition. There is a general agreement on the direct relationship between peripheral resistance and heart rate, decrease in sympathetic activity, decrease in cardiac output and magnitude of BP drop at night [24]. Ohkubo et al. provided initial data on RD prevalence [15], and frequency of RD generally varies between 3% and 10% in different populations in the literature [25,26]. It has been shown in previous studies that the risk of left ventricular hypertrophy increases echocardiographically in individuals with RD and ND patterns [27,28]. In the coronary artery risk development in young adults (CARDIA) study, young adults with less pronounced or absent nocturnal BP fall at the initial evaluation had the greatest risk of developing coronary calcification at 10 to 15 years of follow-up [29]. Also, the strong relationship between increased urinary protein excretion and the RD and ND pattern is among the recently discussed topics [30,31]. When all these data are evaluated, it is clear that the RD and ND pattern is associated with an increased risk of CV disease. Although interest in sleep disorders has increased in recent years, the diagnosis and treatment of these patients is not yet clear. When our findings and data of this literature are evaluated, we think that RD and ND patterns are associated with sleep disorders in healthy individuals and this poses a risk for public health.
In recent years, RD and ND BP pattern in normotensive individuals worries clinicians and the underlying cause is still unclear. In a study by Lee et al. evaluating 703 normotensive adults, the RD pattern showed a significant association with white matter change, after adjusting for covariates [32]. In a study evaluating 509 hypertensive patients by Yan et al. [33], RD pattern was shown to be associated with metabolic syndrome. RD and ND pattern are known to be associated with many different diseases in all age groups [32]. We suspected that sleep disturbance and decreased sleep quality could lead to this condition. However, we think that many factors that may lead to this situation, such as food consumed, social media addiction, occupation of the individual, and increased exposure to blue light, may also be effective. In our study, all these factors could not be evaluated, but we obtained important findings about sleep quality. Increased insomnia and daytime sleepiness in RD and ND groups were the most remarkable findings of our study. These results were significantly different even between RD and ND groups.
We think that our study is important because it is the first study in this field. And it is necessary to evaluate patients with RD and ND BP pattern in normotensive individuals in terms of sleep quality and disorders in detail. Considering the RD and ND BP pattern is associated with an increased CV risk, we think this is important to affect public health. The results we find should be supported by more comprehensive follow-up studies and these individuals should be evaluated in more detail.
The major limitation of this study was single centre design and the small number of cases, and we couldn’t evaluate with polysomnography. Difficulties in ABPM measurements and evaluation of results were other important limitations. Also, surveys such as Functional Outcomes of Sleep Questionnaire and International Restless Legs Scale have not been evaluated. We could not evaluate the factors such as lifestyle of the participants, food consumed, social media addiction, occupation of the individual, and increased exposure to blue light. In addition, the results used in our study are based on the survey data, and although those with OSAS have been excluded, there may have been undiagnosed individuals among our patient groups. Another limitation was the bias problem that might occur in choosing the study population.
Acknowledgements
We would like to thank İbrahim Ersoy for his contributions and nurse Ayşe Özcan for her contributions to ABPM measurements.
Notes
The authors have no potential conflicts of interest to disclose.
Author Contributions
Conception and Design: Zafer Yalım. Data: Zafer Yalım. Analysis and Writing: Zafer Yalım, Sümeyra Alan Yalım. Review and Editing: Zafer Yalım, Sümeyra Alan Yalım. Critical revision: Zafer Yalım, Sümeyra Alan Yalım.