| Home | E-Submission | Sitemap | Contact Us |  
J Sleep Med > Volume 19(3); 2022 > Article
Bae, Kim, Jo, and Joo: Evaluation of Vestibular Function in Sleep Disorders

초록

Objectives

The aim of this study was to evaluate dizziness in patients with sleep disorders, objectively identify vestibular function through the vestibulo-ocular reflex (VOR) using the video Head Impulse Test (vHIT), and evaluate the association between these findings.

Methods

Among the patients who visited the sleep clinic from June to October 2021, 69 who underwent both polysomnography (PSG) and vHIT were included. Participants completed questionnaires including the Dizziness Handicap Inventory (DHI), Beck Anxiety Inventory, Korean-Beck Depression Inventory-II, Epworth Sleepiness Scale, Insomnia Severity Index (ISI), and Pittsburgh Sleep Quality Index (PSQI). The subjects were classified into four groups: insomnia (n=4), rapid eye movement sleep behavior disorder (RBD) (n=13), obstructive sleep apnea syndrome (OSAS) (n=34), and RBD and OSAS (n=18). Moderate to severe OSAS (n=49) was compared with no OSAS and mild OSAS (n=20).

Results

In comparison of the four groups according to sleep disorders, the OSAS patients showed the highest DHI scores and the lowest VOR gain, but statistical significance was not found. Although all VOR gains were within the normal range, the VOR gain of the left posterior semicircular canal was significantly lower in the moderate to severe OSA group than in the no OSA and mild OSA groups (1.02±0.18 vs. 0.94±0.10, p=0.019). DHI total scores showed no correlation with VOR gain but showed a positive correlation with ISI (r=0.422, p=0.001) and PSQI (r=0.287, p=0.022). Among PSG parameters, lowest oxygen saturation (SaO2) and percentage of time with SaO2 less than 90% were correlated with the emotional score of DHI (r=-0.245, p=0.043 and r=0.311, p=0.010, respectively).

Conclusions

Although our study could not objectively confirm vestibular dysfunction in patients with sleep disorders, we found that subjective sleep complaints were associated with dizziness and hypoxic conditions during sleep were associated with emotional aspects of dizziness. This suggests that the treatment of concomitant sleep disorders may improve dizziness.

INTRODUCTION

Dizziness is an erroneous sensation in spatial perception and stability [1]. Patients in primary care commonly complain of dizziness, and 15% to over 20% of adults are affected annually in large population-based studies [2]. Various diseases may cause dizziness, and sleep disorders are often encountered in patients with dizziness. It is known that neurons related to sleep stages are located in the pontine reticular formation and raphe nuclei, where information from otolithic organs is also received [3]. Dysfunctions in these organs could lead to interruptions in the sleep-wake cycle; therefore, the vestibular system is related to sleep regulation [3,4]. The prevalence of sleep disturbances is approximately 65% in patients with chronic dizziness [5]. However, despite the link between dizziness and sleep disturbance, few studies have been conducted on this issue.
Some studies have reported a relationship between sleep disturbance and dizziness. In one study, 30% of patients with vestibular vertigo reported abnormal sleep duration [6], and in another study, patients with non-vertiginous dizziness reported significantly higher Pittsburgh Sleep Quality Index (PSQI) and Insomnia Severity Index (ISI) scores compared with the controls [7]. In recent population-based case-control studies, an association between sleep apnea and a higher incidence of vertigo was noted (hazard ratio, 1.71) [8]. However, most of the preceding studies were questionnaire-based studies, and an objective evaluation of vestibular dysfunction in patients with sleep disorders was lacking. Recently, analysis of vestibuloocular reflex (VOR) gain in physiological conditions through the video Head Impulse Test (vHIT) has been reported in obstructive sleep apnea syndrome (OSAS) patients. The vHIT can provide information on VOR in response to only head movements [9], and it can easily perform quantitative and objective measurements of VOR. However, the results of previous clinical assessments with vHIT in patients were still debated, and there has been no vestibular evaluation through vHIT in sleep disorders other than OSAS.
This study aimed to evaluate dizziness in patients with sleep disorders, detect objective vestibular impairment via vHIT implementation, and determine whether vestibular dysfunction is associated with sleep-related parameters.

METHODS

Subjects

All participants were recruited from our sleep clinic between June 2021 and October 2021. Patients with a significant medical history, psychiatric or neurologic comorbidities, or those unable to cooperate with the study (difficulty filling out questionnaires or cooperating with the vHIT test) were excluded. Participants were required to perform both polysomnography (PSG) and vHIT tests, and 69 patients were finally recruited.
Rapid eye movement (REM) sleep behavior disorder (RBD) and OSAS were classified according to the International Classification of Sleep Disorders (ICSD-3) criteria [10], and enrolled patients with RBD showed no evidence of neurological disease. All participants were classified into four groups: Insomnia, RBD, OSAS, and RBD with OSAS. For patients with both RBD and OSAS, mild OSAS was classified into the RBD group and those with moderate or severe OSAS were classified into the RBD with OSAS group. In further analysis, moderate to severe OSAS was compared with the no OSAS and mild OSAS groups.
The study was approved by the Institutional Ethics Committee of the hospital, and written informed consent was obtained from all enrolled patients (IRB No. 2022-12-114).

Validated questionnaires

The Dizziness Handicap Inventory (DHI)

The DHI is a survey that evaluates a patient’s emotional, physical, and functional quality of life, which is affected by dizziness with 25 questions. It is commonly used in clinical studies [11-13]. Emotional, physical, and functional effects were checked using the DHI scores, both separately and together. Scores range from 0 to 100, and the results are classified into three categories: 16–34 points (mild handicap), 36–52 points (moderate handicap), and ≥54 points (severe handicap). Scores of >10 points were indicated to undergo further evaluation and to be referred to dizziness specialists.

Beck Anxiety Inventory (BAI)

The Korean version of the BAI was used to measure the severity of anxiety symptoms [14]. It asks individuals to score each question on a scale from 0 (not at all) to 3 (severely). The total score ranges from 0 to 63, and higher scores indicate more severe symptoms [14,15].
We used the Korean versions of the Epworth Sleepiness Scale (ESS) [16], Insomnia Severity Index (ISI) [17], PSQI [18], and Korean-Beck Depression Inventory-II (K-BDI-II) [19]. A method previously published by the authors’ group for interpreting these questionnaires was used [20].

PSG

We used Embla N7000 (Medcare-Embla, Reykjavik, Iceland) for the PSG study and the same recording method as in the authors’ previous study [21].
PSG data were scored according to the American Academy of Sleep Medicine Manual [22]. We collected the following PSG data: sleep parameters (total sleep time, arousal index [AI], and sleep efficiency), sleep stage (N1, N2, N3, and REM sleep, %), apnea-hypopnea index (AHI), respiratory disturbance index (RDI), oxygen desaturation index (ODI), lowest oxygen saturation (SaO2), and percentage of time with SaO2 less than 90%.

vHIT

All participants underwent standardized 6-canal-vHIT assessments. Six-canal vHIT was performed by an experienced technician using SLVNG (SLMED, Seoul, Korea), and the targeted velocity was >200°/s for accurate and reproducible results. Normal limits for VOR gain were considered as follows: ≥0.8 for the left lateral semicircular and right lateral semicircular canals [23,24] and ≥0.7, for the left anterior semicircular, right posterior semicircular, left posterior semicircular, and right anterior semicircular canals [25,26].

Statistical analysis

SPSS version 21.0 (IBM Corporation, Armonk, NY, USA) for Windows (Microsoft Corporation, Redmond, WA, USA) was used for all the statistical analyses. Differences noted with a two-tailed p<0.05 were considered as statistically significant. Descriptive data were expressed as mean±standard deviation or as frequencies and percentages. The Shapiro-Wilk test was used as the normality test.
Kruskal-Wallis test and Pearson chi-square test were used to compare demographic, validated questionnaires, polysomnographic, and vHIT values between the four groups, while Mann-Whitney U test was performed for comparison between no OSAS, mild OSAS, and moderate to severe OSAS groups. The chi-squared test or Fisher’s exact test were used to analyze categorical variables.
Spearman’s rank correlation was performed between polysomnographic parameters, validated questionnaires, VOR gain in the vHIT test, and DHI scores.

RESULTS

Vestibular evaluation in sleep disorders

A total of 69 patients underwent both PSG and vHIT tests. Of these, 4 were classified as having primary insomnia (2 males; mean age 56.3±9.5), 13 as RBD (9 males; mean age 66.0±8.5), 34 as OSAS (25 males; mean age 59.7±9.5), and 18 (14 males; mean age 68.9±7.4) as RBD with OSAS.
The mean age of patients with RBD was higher, but there was no sex difference between the groups. The DHI-total scores were highest in the OSAS group, and only the OSAS group showed a score higher than 10 (requiring further evaluation), but there was no significant difference in scores between the groups. The BAI, ISI, and PSQI scores were highest in the insomnia group, but the difference was not statistically significant. In terms of polygraphic scores, the OSAS group showed high AI, AHI, ODI, and the lowest SaO2 values, which were statistically significant. The vHIT results showed the lowest average VOR gain and the largest number of patients with vestibular impairment in the OSAS group; however, the difference was not statistically significant. In the left horizontal semicircular canal, the VOR gain was below the normal range (<0.8) in the OSAS group, but there was no significant difference between the groups. Detailed information is presented in Table 1.
When comparing the results of subjective and objective vestibular dysfunction according to sleep disorders, no statistical significance was confirmed; however, vestibular dysfunction showed the most severe tendency in the OSAS group. For further evaluation, as described in the next section, all subjects were classified according to AHI and compared.

Vestibular evaluation in OSAS patients

When classifying a total of 69 patients according to AHI, they were classified into two groups: no OSAS and mild OSAS (20/69, 29.0%) and moderate-to-severe OSAS (49/69, 71.0%).
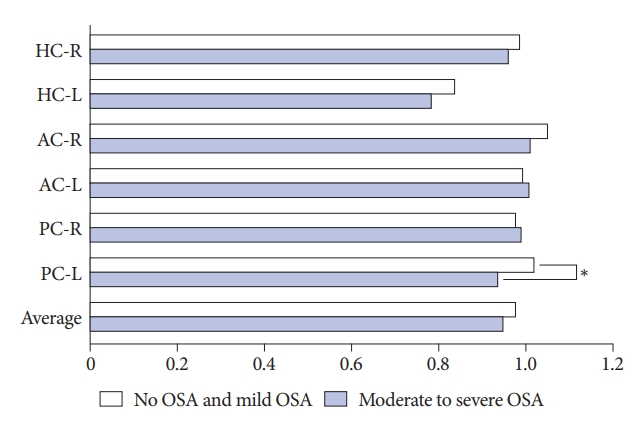
There was no difference in the mean age and sex between the two groups. Subjective dizziness evaluated by DHI showed a tendency to be more severe in the moderate-to-severe OSAS group, but the difference was not statistically significant. Polygraphic results showed higher AI, AHI, and ODI values and lower SaO2 values in the moderate to severe OSAS group. In the vHIT results, the gain of the left posterior semicircular canal was significantly lower in the moderate to severe group (1.02±0.18 vs. 0.94±0.10, p=0.019) (Fig. 1), but there was no significant difference in other values. Detailed information is presented in Table 2.

Correlation analysis

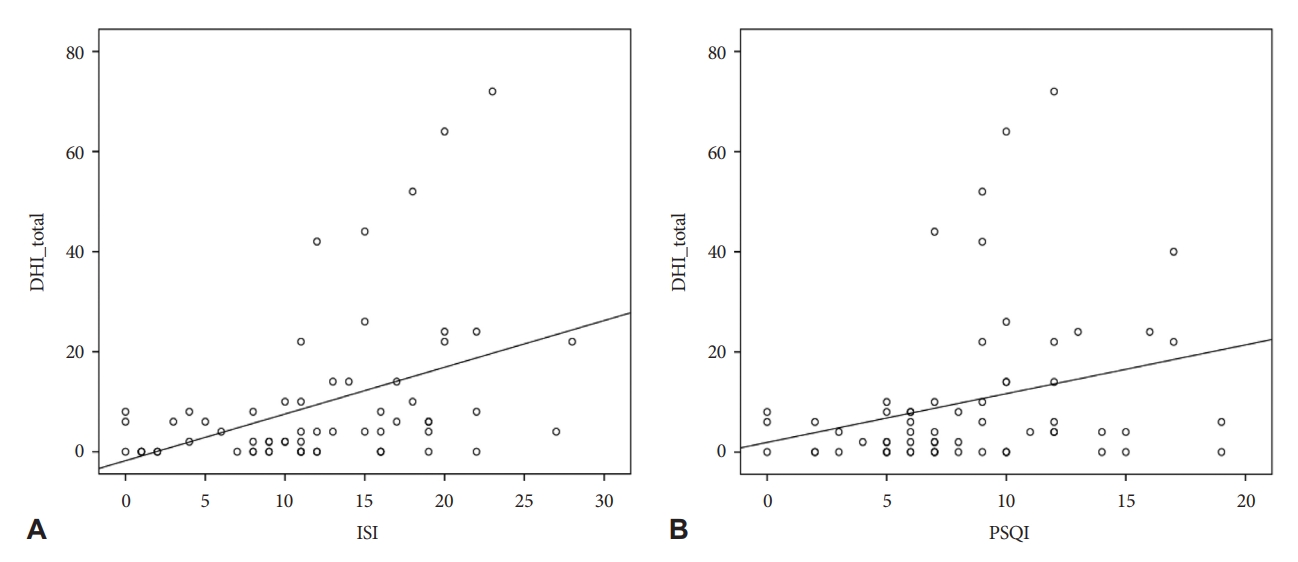
Emotional scores of DHI (DHI-E) were negatively correlated with the lowest SaO2 value (r=-0.245, p=0.043) and a positive correlation with the percentage of time with SaO2 less than 90% (r=0.311, p=0.010). The DHI scores showed a strong positive correlation with the BAI, and the K-BDI-II scores showed a positive correlation with the DHI-P and DHI-total scores. In addition, the ISI and PSQI values showed a positive correlation with the DHI (Fig. 2), but ESS values showed no correlation with the DHI. However, there was no significant association between the DHI scores and vHIT results. Detailed information is presented in Table 3.

DISCUSSION

In this study, we investigated subjective and objective vestibular impairments in patients with sleep disturbance. Although there was no statistically significant difference in vestibular impairment according to disease group, OSAS patients showed higher DHI scores and lower VOR gains than those with insomnia or RBD. In addition, although within the normal range, the VOR gain of the left posterior semicircular canal was significantly lower in patients with moderate to severe OSAS than in those with no OSAS and mild OSAS. In addition, subjective dizziness (DHI) showed a positive correlation with subjective sleep complaints (PSQI and ISI), and emotional aspects of dizziness (DHI-E) correlated with saturation-related indicators (lowest SaO2 and total duration with oxygen saturation levels lower than 90%) among the PSG parameters. However, dizziness was not significantly correlated with vHIT results.
The association between sleep disorders and vestibular impairment has been reported in several studies. The interconnection between the vestibular nucleus and the suprachiasmatic hypothalamic nucleus, which is the principal structure for circadian rhythm control, may contribute to this association. Moreover, sleep deprivation in humans can alter the function of the posterior parietal cortex, which is pivotal for vestibular inflow processing and VOR control [27,28]. These theoretical backgrounds suggest that Circadian Rhythm Sleep-Wake Disorders and sleep deprivation are related to vestibular dysfunction. In our study, we could not confirm vestibular dysfunction in the insomnia group; however, our sample size was small. Therefore, it is necessary to conduct an evaluation with a larger number of patients.
In RBD, vestibular function could be altered because brainstem structures, such as the pontine tegmentum and medial medulla oblongata, are involved in the pathophysiology of RBD [29,30]. One previous study suggested brainstem pathway dysfunction by vestibular-evoked myogenic potentials in RBD with psychogenic dizziness patients [31]. To the best of our knowledge, there have been no studies on vestibular dysfunction in patients with RBD using the vHIT. Although the DHI scores and VOR gain in the vHIT of RBD patients in our study were within the normal range, our results could serve as a basis for further studies on vestibular dysfunction in patients with RBD.
OSAS, characterized by recurrent apneic episodes, causes hypoxic conditions during sleep, and chronic hypoxia during sleep results in alteration of vestibular function. This can be explained by the anatomical contiguity of the vestibular and respiratory nuclei [32]. Supporting this assumption, several previous studies have shown that moderate to severe OSAS results in more severe vestibular dysfunction than mild OSAS [32-34].
In the past, the evaluation of vestibular function was mostly performed by low-frequency VOR analysis through a caloric test [32-34], but recently, studies that performed VOR analysis using the vHIT test that reflects more physiological conditions are increasing. Micarelli et al. [35] reported that patients with moderate to severe OSAS had lower VOR gain than healthy subjects and that VOR gain was positively correlated with mean SaO2 during sleep. In a study by Birk et al. [36], there were more cases with pathological results (reduced gain) of vHIT in the OSAS group than in the healthy control group, but statistical significance was not confirmed. Alessandrini et al. [37] compared VOR gains by performing vHIT before and after 12 months of continuous positive airway pressure (CPAP) treatment in patients with moderate-to-severe OSAS. Although VOR gain did not demonstrate significant improvement, this study might provide further perspectives for future studies to assess VOR gain changes after longer periods of CPAP treatment. Although statistical significance was not confirmed in our study, the OSAS group had the highest DHI score and lowest VOR gain. In addition, although it was within the normal range, the VOR gain of the left posterior semicircular canal was significantly lower in the moderate-to-severe OSAS group than in the no OSAS and mild OSAS groups. These results support the hypothesis that hypoxic conditions in the OSAS are associated with vestibular dysfunction. The VOR gain within the normal range in our study can be explained in relation to the central vestibular system. The hypothesis that the central vestibular system is highly resistant to hypoxic conditions and will therefore continuously compensate for the deficit of peripheral vestibular conditions has been suggested in a previous study [32].
Another important point in our study was that subjective dizziness (DHI scores) was strongly correlated with subjective sleep complaints (PSQI and ISI) in patients with sleep disorders. These results suggest that relieving subjective sleep discomfort can improve or resolve dizziness. Among the PSG parameters, saturation-related indicators (lowest SaO2 and percentage of time with SaO2 less than 90%) were associated with DHI-E scores, which supports the hypothesis that hypoxemia conditions in OSAS may induce vestibular dysfunction.
In conclusion, although our study could not objectively confirm vestibular dysfunction in patients with sleep disorders, we found that subjective sleep complaints associated with dizziness and hypoxic conditions during sleep were associated with emotional aspects of dizziness. This suggests that the treatment of concomitant sleep disorders may improve dizziness.
The strengths of our study are that vestibular function was evaluated in patients with sleep disorders, particularly RBD and OSAS, and vestibular function was objectively evaluated through the vHIT test, as well as subjective dizziness through a questionnaire. However, the small sample size and absence of healthy controls (without sleep disorders) are limitations of our study. In addition, owing to the retrospective nature of the study, the causality of the association shown in the results remains insufficient. However, further studies are required to address these limitations.

Notes

Conflicts of Interest
The authors have no potential conflicts of interest to disclose.
Author Contributions
Conceptualization: Hyunjin Jo, Eun Yeon Joo. Data Curation: Hyoeun Bae, Hyunjin Jo. Methodology: all authors. Supervision: Eun Yeon Joo. Validation: all authors. Visualization: Hyoeun Bae, Hyunjin Jo. Writing—original draft: Hyoeun Bae. Writing—review & editing: all authors.
Funding Statement
This research was supported by a grant of the Korea Health Technology R&D Project through the Korea Health Industry Development Institute (KHIDI), funded by the Ministry of Health & Welfare, Republic of Korea (Grant Number : HI19C1328).

Figure 1.
VOR gain when detected by means of vHIT in two groups; normal and mild OSA group and moderate-to-severe OSA group. *p<0.05. VOR, vestibulo-ocular reflex; vHIT, video Head Impulse Test; HC-R, right horizontal semicircular canal; HC-L, left horizontal semicircular canal; AC-R, right anterior semicircular canal; AC-L, left anterior semicircular canal; PC-R, right posterior semicircular canal; PC-L, left posterior semicircular canal; OSA, obstructive sleep apnea.
jsm-220011f1.jpg
Figure 2.
A positive correlation between DHI scores and ISI (A) and PSQI (B). DHI, Dizziness Handicap Inventory; ISI, Insomnia Severity Index; PSQI, Pittsburgh Sleep Quality Index.
jsm-220011f2.jpg
Table 1.
Comparison of demographic, validated questionnaires, polysomnographic, and vHIT values in sleep disorders (n=69)
Insomniaa (n=4) RBDb (n=13) OSASc (n=34) RBD with OSASd (n=18) p
Age, years 56.3±9.5 66.0±8.5 59.7±9.5 68.9±7.4 0.002* (c<d)
Sex, male 2 (50.0) 9 (69.2) 25 (73.5) 14 (77.8) 0.721
Validated questionnaires
DHI
 DHI-F 1.5±1.0 3.4±7.5 4.2±7.2 2.3±5.2 0.874
 DHI-E 1.0±2.0 2.0±5.4 3.2±6.3 2.0±4.5 0.637
 DHI-P 4.0±2.8 3.5±5.2 4.0±4.0 3.0±3.8 0.648
 DHI-total 6.5±5.0 8.9±17.9 11.5±16.5 7.3±12.6 0.681
BAI 12.0±7.8 7.3±6.5 10.2±9.1 7.2±7.6 0.475
K-BDI-II 17.5±11.7 17.5±11.6 13.3±6.7 14.8±8.5 0.741
ESS 11.8±7.5 10.4±5.7 10.3±4.4 8.5±4.2 0.649
ISI 17.3±6.6 13.1±8.5 12.3±6.1 9.5±6.6 0.226
PSQI 10.0±5.1 9.2±5.2 8.8±4.2 6.4±3.9 0.326
Polysomnographic parameters
TST 391.5±51.3 337.7±70.8 319.0±82.5 338.0±62.1 0.315
AI 20.0±6.2 18.8±8.4 36.6±22.2 34.3±25.6 0.005* (a, b<c, d)
SE 87.8±5.9 77.2±15.1 75.3±16.4 80.5±7.8 0.354
AHI 5.6±5.1 8.3±3.8 39.2±23.1 33.1±25.7 <0.001* (a, b<c, d)
ODI 3.4±5.2 5.1±2.5 33.2±20.2 24.6±20.7 <0.001* (a, b<c, d)
Lowest SaO2 92.0±2.2 89.8±2.8 81.6±5.9 86.3±3.9 <0.001* (a, b>d>c)
vHIT
vHIT-HC-R 1.06±0.11 0.98±0.10 0.94±0.12 1.00±0.15 0.221
vHIT-HC-L 1.06±0.54 0.80±0.14 0.76±0.11 0.82±0.18 0.266
vHIT-AC-R 1.08±0.19 1.05±0.16 1.00±0.21 1.03±0.10 0.930
vHIT-AC-L 0.96±0.13 1.02±0.12 0.98±0.21 1.05±0.13 0.405
vHIT-PC-R 0.99±0.14 0.96±0.12 1.00±0.09 0.97±0.08 0.266
vHIT-PC-L 0.98±0.16 0.98±0.08 0.96±0.16 0.94±0.10 0.508
Average gain 1.02±0.11 0.96±0.06 0.94±0.08 0.97±0.07 0.400
Vestibular impairment 2 (50.0) 7 (53.8) 23 (67.6) 11 (61.1) 0.778

Data are presented as mean±standard deviation or n (%).

* p<0.05;

Pearson chi-square test.

RBD, rapid eye movement sleep behavior disorder; OSAS, obstructive sleep apnea syndrome; DHI, Dizziness Handicap Inventory; BAI, Beck Anxiety Index; K-BDI-II, Korean version of the Beck Depression Inventory; ESS, Epworth Sleepiness Scale; ISI, Insomnia Severity Index; PSQI, Pittsburgh Sleep Quality Index; TST, total sleep time; AI, arousal index; SE, sleep efficiency; AHI, apnea-hypopnea index; ODI, oxygen desaturation index; Lowest SaO2, lowest O2 saturation; vHIT, video Head Impulse Test; HC-R, right horizontal semicircular canal; HC-L, left horizontal semicircular canal; AC-R, right anterior semicircular canal; AC-L, left anterior semicircular canal; PC-R, right posterior semicircular canal; PC-L, left posterior semicircular canal

Table 2.
Comparison of demographic, validated questionnaires, polysomnographic, and vHIT values between the two groups
No OSAS & mild OSA (n=20) Moderate to severe OSA (n=49) p
Age 62.8±9.1 63.2±9.9 0.766
Sex, male 14 (70.0) 36 (73.5) 0.771
Validated questionnaires
DHI
 DHI-F 2.6±6.1 3.8±6.7 0.625
 DHI-E 1.5±4.5 3.0±5.9 0.140
 DHI-P 3.1±4.5 3.9±3.9 0.268
 DHI-total 7.2±14.7 10.6±15.6 0.190
BAI 8.2±7.2 9.3±8.6 0.736
K-BDI-II 17.4±10.7 13.6±7.2 0.226
ESS 10.6±5.5 9.7±4.5 0.727
ISI 13.8±7.7 11.3±6.4 0.149
PSQI 9.4±4.8 8.0±4.3 0.319
Polysomnographic parameters
TST 355.9±66.7 321.8±76.1 0.079
AI 19.0±7.4 36.2±23.5 <0.001*
SE 80.8±13.2 76.5±14.3 0.159
AHI 8.5±4.3 38.6±23.9 <0.001*
ODI 5.5±3.7 31.7±20.5 <0.001*
Lowest SaO2 90.0±2.8 83.0±5.8 <0.001*
vHIT
vHIT-HC-R 0.99±0.13 0.96±0.12 0.225
vHIT-HC-L 0.84±0.27 0.78±0.14 0.721
vHIT-AC-R 1.05±0.17 1.01±0.18 0.920
vHIT-AC-L 0.99±0.13 1.01±0.19 0.346
vHIT-PC-R 0.98±0.12 0.99±0.09 0.571
vHIT-PC-L 1.02±0.18 0.94±0.10 0.019*
Average gain 0.98±0.07 0.95±0.08 0.213
Vestibular impairment 12 (60.0) 31 (63.3) 0.721

Data are presented as mean±standard deviation or n (%).

* p<0.05;

Pearson chi-square test.

OSAS, obstructive sleep apnea syndrome; DHI, Dizziness Handicap Inventory; BAI, Beck Anxiety Index; K-BDI-II, Korean version of the Beck Depression Inventory; ESS, Epworth Sleepiness Scale; ISI, Insomnia Severity Index; PSQI, Pittsburgh Sleep Quality Index; TST, total sleep time; AI, arousal index; SE, sleep efficiency; AHI, apnea-hypopnea index; ODI, oxygen desaturation index; Lowest SaO2, lowest O2 saturation; vHIT, video Head Impulse Test; HC-R, right horizontal semicircular canal; HCL, left horizontal semicircular canal; AC-R, right anterior semicircular canal; AC-L, left anterior semicircular canal; PC-R, right posterior semicircular canal; PC-L, left posterior semicircular canal

Table 3.
Correlation analysis between DHI and validated questionnaires, polysomnographic, and vHIT values
DHI-F DHI-E DHI-P DHI-total
Validated questionnaires
 BAI 0.641* 0.602* 0.620* 0.658*
 K-BDI-II 0.210 0.207 0.317* 0.249*
 ESS -0.046 -0.053 0.022 -0.033
 ISI 0.422* 0.346* 0.421* 0.418*
 PSQI 0.287* 0.234 0.259* 0.276*
Polysomnographic parameters
 TST -0.068 -0.012 -0.027 -0.030
 AI 0.039 0.088 0.203 0.173
 SE 0.038 0.054 -0.009 0.007
 AHI 0.070 0.227 0.147 0.180
 ODI 0.046 0.225 0.126 0.157
 Lowest SaO2 -0.108 -0.245* -0.106 -0.153
 Time with SaO2 less than 90% (%) 0.164 0.311* 0.189 0.219
vHIT
 vHIT-HC-R 0.140 0.026 0.082 0.102
 vHIT-HC-L 0.055 0.032 0.027 0.045
 vHIT-AC-R 0.152 0.124 0.045 0.086
 vHIT-AC-L 0.040 0.030 0.049 0.022
 vHIT-PC-R 0.289* 0.180 0.075 0.154
 vHIT-PC-L 0.087 -0.039 -0.120 -0.070
 Average gain 0.186 0.063 0.023 0.062

Spearman rho values are presented.

* p<0.05.

DHI, Dizziness Handicap Inventory; BAI, Beck Anxiety Index; K-BDI-II, Korean version of the Beck Depression Inventory; ESS, Epworth Sleepiness Scale; ISI, Insomnia Severity Index; PSQI, Pittsburgh Sleep Quality Index; TST, total sleep time; AI, arousal index; SE, sleep efficiency; AHI, apnea-hypopnea index; ODI, oxygen desaturation index; Lowest SaO2, lowest O2 saturation; vHIT, video Head Impulse Test; HC-R, right horizontal semicircular canal; HC-L, left horizontal semicircular canal; AC-R, right anterior semicircular canal; AC-L, left anterior semicircular canal; PC-R, right posterior semicircular canal; PC-L, left posterior semicircular canal

REFERENCES

1. Neuhauser HK, Radtke A, von Brevern M, Lezius F, Feldmann M, Lempert T. Burden of dizziness and vertigo in the community. Arch Intern Med 2008;168:2118-2124. https://doi.org/10.1001/archinte.168.19.2118.
crossref pmid
2. Neuhauser HK. The epidemiology of dizziness and vertigo. Handb Clin Neurol 2016;137:67-82. https://doi.org/10.1016/B978-0-444-63437-5.00005-4.
crossref pmid
3. Andrade Junior MC, Stefanini R, Gazzola JM, Haddad FLM, Ganança FF. Individuals with peripheral vestibulopathy and poor quality of sleep are at a higher risk for falls. Braz J Otorhinolaryngol 2021;87:440-446. https://doi.org/10.1016/j.bjorl.2019.10.013.
crossref pmid pmc
4. Bolton PS, Goto T, Schor RH, Wilson VJ, Yamagata Y, Yates BJ. Response of pontomedullary reticulospinal neurons to vestibular stimuli in vertical planes. Role in vertical vestibulospinal reflexes of the decerebrate cat. J Neurophysiol 1992;67:639-647. https://doi.org/10.1152/jn.1992.67.3.639.
crossref pmid
5. Sugaya N, Arai M, Goto F. The effect of sleep disturbance in patients with chronic dizziness. Acta Otolaryngol 2017;137:47-52. https://doi.org/10.1080/00016489.2016.1213418.
crossref pmid
6. Albathi M, Agrawal Y. Vestibular vertigo is associated with abnormal sleep duration. J Vestib Res 2017;27:127-135. https://doi.org/10.3233/VES-170617.
crossref pmid
7. Seo IK, Choi YI, Jeong DS, Park HK, Hwangbo Y, Yang KI. Association between sleep quality and non-vertiginous dizziness: a hospital-based case-control study. J Korean Sleep Res Soc 2013;10:15-19. https://doi.org/10.13078/jksrs.13003.
crossref
8. Tsai MS, Lee LA, Tsai YT, et al. Sleep apnea and risk of vertigo: a nationwide population-based cohort study. Laryngoscope 2018;128:763-768. https://doi.org/10.1002/lary.26789.
crossref pmid
9. MacDougall HG, Weber KP, McGarvie LA, Halmagyi GM, Curthoys IS. The video head impulse test: diagnostic accuracy in peripheral vestibulopathy. Neurology 2009;73:1134-1141. https://doi.org/10.1212/WNL.0b013e3181bacf85.
crossref pmid pmc
10. Sateia MJ. International classification of sleep disorders-third edition: highlights and modifications. Chest 2014;146:1387-1394. https://doi.org/10.1378/chest.14-0970.
crossref pmid
11. Jacobson GP, Newman CW. The development of the dizziness handicap inventory. Arch Otolaryngol Head Neck Surg 1990;116:424-427. https://doi.org/10.1001/archotol.1990.01870040046011.
crossref pmid
12. Whitney SL, Marchetti GF, Morris LO. Usefulness of the dizziness handicap inventory in the screening for benign paroxysmal positional vertigo. Otol Neurotol 2005;26:1027-1033. https://doi.org/10.1097/01.mao.0000185066.04834.4e.
crossref pmid
13. Karapolat H, Eyigor S, Kirazlı Y, Celebisoy N, Bilgen C, Kirazli T. Reliability, validity and sensitivity to change of Turkish dizziness handicap inventory (DHI) in patients with unilateral peripheral vestibular disease. Int Adv Otol 2009;5:237-245. https://doi.org/10.1097/01.mao.0000185066.04834.4e.
crossref pmid
14. Yook SP, Kim ZS. A clinical study on the Korean version of beck anxiety inventory: comparative study of patient and non-patient. Korean J Clin Psychol 1997;16:185-197. https://doi.org/10.1097/01.mao.0000185066.04834.4e.
crossref pmid
15. Beck AT, Epstein N, Brown G, Steer RA. An inventory for measuring clinical anxiety: psychometric properties. J Consult Clin Psychol 1988;56:893-897. https://doi.org/10.1037//0022-006x.56.6.893.
crossref pmid
16. Cho YW, Lee JH, Son HK, Lee SH, Shin C, Johns MW. The reliability and validity of the Korean version of the Epworth sleepiness scale. Sleep Breath 2011;15:377-384. https://doi.org/10.1007/s11325-010-0343-6.
crossref pmid
17. Cho YW, Song ML, Morin CM. Validation of a Korean version of the insomnia severity index. J Clin Neurol 2014;10:210-215. https://doi.org/10.3988/jcn.2014.10.3.210.
crossref pmid pmc
18. Sohn SI, Kim DH, Lee MY, Cho YW. The reliability and validity of the Korean version of the Pittsburgh Sleep Quality Index. Sleep Breath 2012;16:803-812. https://doi.org/10.1007/s11325-011-0579-9.
crossref pmid
19. Sung HM, Kim JB, Park YN, Bai DS, Lee SH, Ahn HN. A study on the reliability and the validity of Korean version of the beck depression inventory-II (BDI-II). J Korean Soc Biol Ther Psychiatry 2008;14:201-212. https://doi.org/10.1007/s11325-011-0579-9.
crossref pmid
20. Jo H, Kim D, Song J, Choi S, Joo E. Sleep disturbances and phenoconversion in patients with REM sleep behavior disorder. J Clin Med 2021;10:4709. https://doi.org/10.3390/jcm10204709.
crossref pmid pmc
21. Chung YH, Kim JR, Choi SJ, Joo EY. Prevalence and predictive factors of nocturia in patients with obstructive sleep apnea syndrome: a retrospective cross-sectional study. PLoS One 2022;17:e0267441. https://doi.org/10.1371/journal.pone.0267441.
crossref pmid pmc
22. Berry RB, Brooks R, Gamaldo C, et al. AASM scoring manual updates for 2017 (version 2.4). J Clin Sleep Med 2017;13:665-666. https://doi.org/10.5664/jcsm.6576.
crossref pmid pmc
23. Alhabib SF, Saliba I. Video head impulse test: a review of the literature. Eur Arch Otorhinolaryngol 2017;274:1215-1222. https://doi.org/10.1007/s00405-016-4157-4.
crossref pmid
24. Yang CJ, Lee JY, Kang BC, Lee HS, Yoo MH, Park HJ. Quantitative analysis of gains and catch-up saccades of video-head-impulse testing by age in normal subjects. Clin Otolaryngol 2016;41:532-538. https://doi.org/10.1111/coa.12558.
crossref pmid
25. MacDougall HG, McGarvie LA, Halmagyi GM, Curthoys IS, Weber KP. Application of the video head impulse test to detect vertical semicircular canal dysfunction. Otol Neurotol 2013;34:974-979. https://doi.org/10.1097/MAO.0b013e31828d676d.
crossref pmid
26. Macdougall HG, McGarvie LA, Halmagyi GM, Curthoys IS, Weber KP. The video head impulse test (vHIT) detects vertical semicircular canal dysfunction. PLoS One 2013;8:e61488. https://doi.org/10.1371/journal.pone.0061488.
crossref pmid pmc
27. Drummond S, Brown G. The effects of total sleep deprivation on cerebral responses to cognitive performance. Neuropsychopharmacol 2001;25(Suppl 1):S68-S73. https://doi.org/10.1016/S0893-133X(01)00325-6.
crossref pmid
28. Quarck G, Ventre J, Etard O, Denise P. Total sleep deprivation can increase vestibulo-ocular responses. J Sleep Res 2006;15:369-375. https://doi.org/10.1111/j.1365-2869.2006.00550.x.
crossref pmid
29. Oliveira P, Cardoso F. Impact of rapid eye movement sleep behavior disorder and autonomic disorders on Parkinson’s disease: a review. Arq Neuropsiquiatr 2021;79:156-166. https://doi.org/10.1590/0004-282Xanp-2020-0173.
crossref pmid
30. Boeve BF, Silber MH, Saper CB, et al. Pathophysiology of REM sleep behaviour disorder and relevance to neurodegenerative disease. Brain 2007;130(Pt 11):2770-2788. https://doi.org/10.1093/brain/awm056.
crossref pmid
31. Xie WY, Shen Y, Chen Y, et al. REM sleep without atonia and vestibular-evoked myogenic potentials: clinical brainstem dysfunction in early-stage Parkinson’s disease and isolated REM sleep behavior disorder. Sleep Med 2022;89:122-129. https://doi.org/10.1016/j.sleep.2021.12.004.
crossref pmid
32. Gallina S, Dispenza F, Kulamarva G, Riggio F, Speciale R. Obstructive sleep apnoea syndrome (OSAS): effects on the vestibular system. Acta Otorhinolaryngol Ital 2010;30:281-284. https://doi.org/10.1016/j.sleep.2021.12.004.
crossref pmid pmc
33. Kayabasi S, Iriz A, Cayonu M, et al. Vestibular functions were found to be impaired in patients with moderate-to-severe obstructive sleep apnea. Laryngoscope 2015;125:1244-1248. https://doi.org/10.1002/lary.25021.
crossref pmid
34. Mutlu M, Bayır Ö, Yüceege MB, et al. Vestibular evoked myogenic potential responses in obstructive sleep apnea syndrome. Eur Arch Otorhinolaryngol 2015;272:3137-3141. https://doi.org/10.1007/s00405-014-3294-x.
crossref pmid
35. Micarelli A, Liguori C, Viziano A, Izzi F, Placidi F, Alessandrini M. Integrating postural and vestibular dimensions to depict impairment in moderate-to-severe obstructive sleep apnea syndrome patients. J Sleep Res 2017;26:487-494. https://doi.org/10.1111/jsr.12516.
crossref pmid
36. Birk R, Dietz M, Sommer JU, et al. Nightly hypoxia does not seem to lead to otolith dysfunction in patients with obstructive sleep apnea. Ear Nose Throat J 2021;100:667-672. https://doi.org/10.1177/0145561320922126.
crossref pmid
37. Alessandrini M, Liguori C, Viziano A, et al. Postural and vestibular changes related to CPAP treatment in moderate-to-severe OSA patients: a 12-month longitudinal study. Sleep Breath 2019;23:665-672. https://doi.org/10.1007/s11325-018-1754-z.
crossref pmid
Editorial Office
Joong-Ang Bldg., 18-8, Wonhyo-ro 89 Gil, Yonsan-gu, Seoul 04314, Republic of Korea
Tel: +82-2-717-5114   Fax: +82-2-717-5515   E-mail: jsleepmed@e-jsm.org

Copyright© Korean Sleep Research Society.                Developed in M2PI
About |  Browse Articles |  Current Issue |  For Authors and Reviewers